Report 2023


Based on all of the above, we declared our 2030 Vision, identifying the work fronts that make these results and impacts possible, giving us all, regardless of the business or country where we are, the same clarity on how we meet our objectives and corporate purpose.
The year 2023 was marked by challenges in economic and consumption terms, especially high interest rates, economic slowdown, volatility in commodity prices, gradual reduction of inflation -particularly in the food segment- and a more conscious consumption decision making by the market, seeking to maximize the cost/benefit ratio.
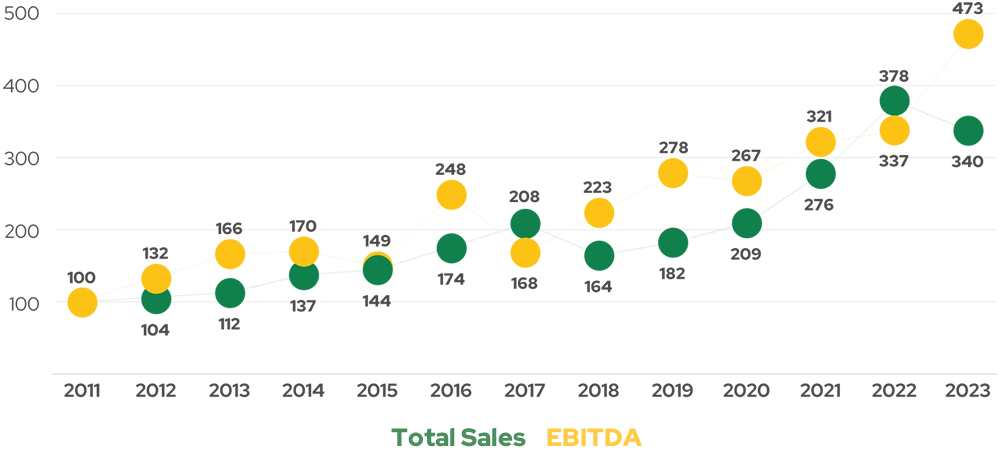
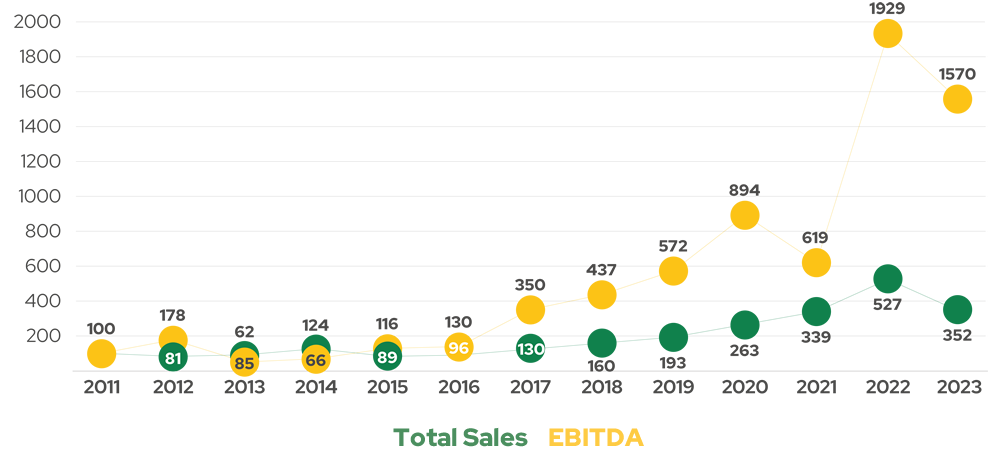
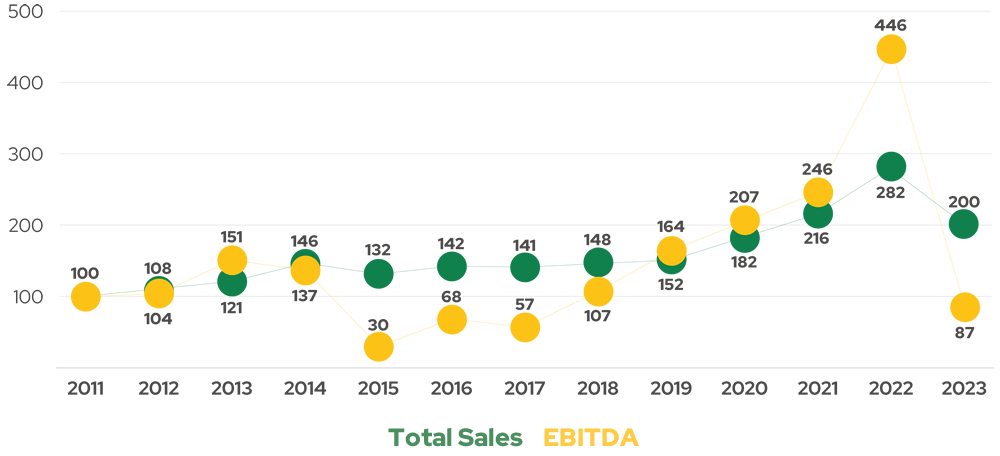
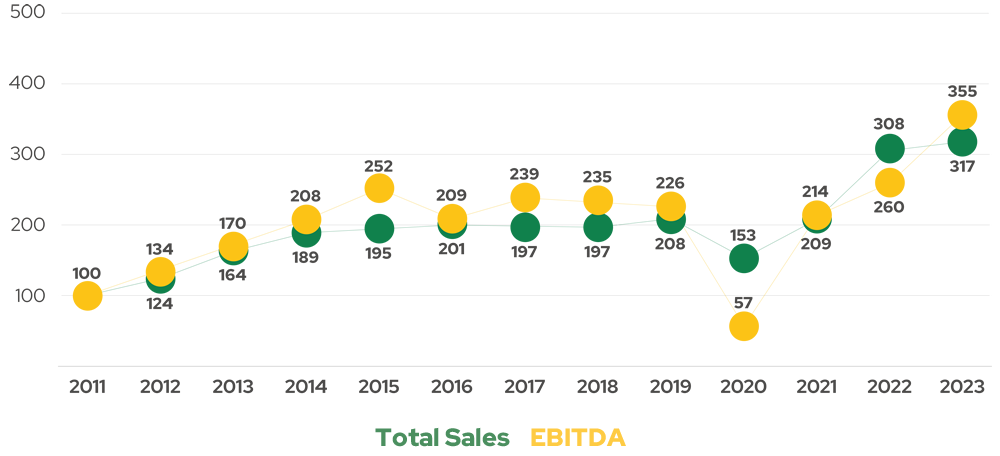
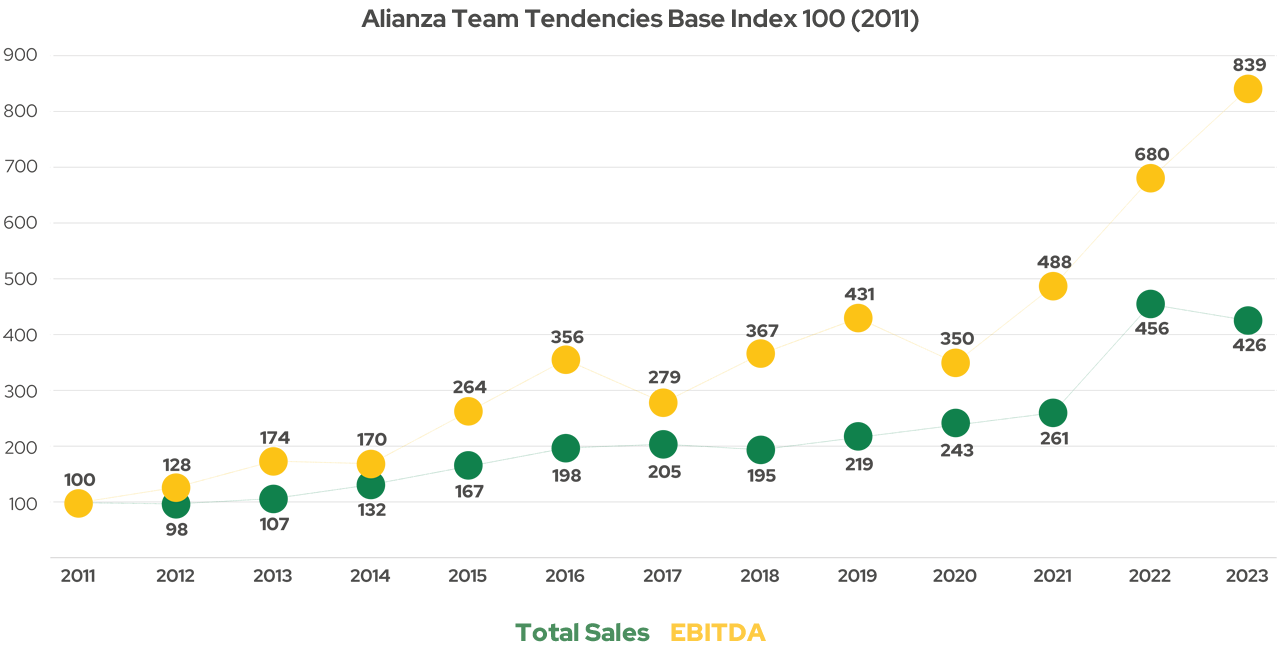
In this context, our commitment and strategy is focused on the profitable growth of our businesses, through the generation of value for our customers and other stakeholders. We achieved a solid performance, with EBITDA growth of 23%, reflecting our ability to generate sustainable value in an increasingly complex, volatile, and uncertain environment.
Based on all of the above, we declared our 2030 Vision, identifying the work fronts that make these results and impacts possible, giving us all, regardless of the business or country where we are, the same clarity on how we meet our objectives and corporate purpose.
Impacting our
To enhance the well-being of our people and contribute to an improvement in their quality of life.
Impacting our
To empower and contribute to the development of our allies and communities.
Impacting our
Ensure compliance with our principles and values throughout the value chain.
Impacting our
To leave a better planet for future generations.
| Economic Value Created and Distributed Alianza Team (millions of COP) | 2023 |
|---|---|
| (EVG) Total Revenue: net sales plus income from financial investments and sale of assets. | 3.192.667 |
| (EVD) Operating costs: payments to suppliers, royalties and facilitation payments. | 2.260.433 |
| (EVD) Employee wages and benefits: total payments made to employees and social contributions. Does not include future payment commitments. | 326.575 |
| (EVD) Payments to providers of capital: dividends paid to all types of shareholders. | 77.867 |
| (EVD) Payments to governments: all company taxes, contributions and penalties. Includes payments to regulatory agencies. | 42.435 |
| (EVD) Community investments: voluntary contributions and investment of funds in the community. | 1.118 |
| Total EVD (does not include income) | 2.708.429 |
Breakdown by country (plot in a single graph as last year)
